Category: Health

  • Do ADHD drugs really reduce adverse life outcomes?

    I’ve been seeing this study by Zhang et al in the news and on subreddits, with claims that it confirms ADHD drugs improve life outcomes.

    It’s an interesting study that uses methods to emulate an RCT using public registry data. However, it’s doubtful that the adjustments really eliminate bias. I’ve spent a lot of time analysing public registry data and their bias is very stubborn. While the study looks impressive there are a number of issues that reduce its value as evidence.

    Confounding
    Why did one group take medicine and the other didn’t? I couldn’t see an explanation. The baseline table shows clear differences between the groups, particularly in comorbidities, e.g. double the prevalence of schizophrenia in the non-treatment group. The authors claim to adjust for confounders but it’s not clear how or whether this will really eliminate bias. They admit residual confounding is likely to remain and this is a general weakness with analyses based on registry data.

    Censoring
    The study uses the per-protocol method of handling those who drop out (by excluding them) which is prone to bias. Stimulants tend to work quickly so people may have stopped using them due to a lack of benefits. This introduces survivorship bias because only people who benefit from the drugs are included, but this is what the study purports to show! The study claims to adjust for this but it’s not clear how this is done or whether it really eliminates bias. The flow diagram should clearly include the numbers who drop out but I can’t see them.

    Effect sizes
    The effects as percentages might look impressive, relative effects usually do, but the absolute numbers are small: suicidal behaviours (weighted incidence rates 14.5 per 1000 person years in the initiation group versus 16.9 in the non-initiation group), substance misuse (58.7 v 69.1), transport accidents (24.0 v 27.5), criminality (65.1 v 76.1), accidental injuries (88.5 v 90.1), presumably all per 1000 person years. Considering how effective ADHD drugs are claimed to be, these numbers don’t seem particularly impressive.

    Data
    The authors admit that residual confounding may remain. And this is nearly always the case with registry data. It’s also very difficult with registry data to duplicate results, particularly when complex adjustment methods are used such as in this study; small coding changes can alter the results significantly. An additional limitation in a pseudo-RCT like this is that there is no placebo group, as would usually be the case in an RCT.

    Conflicts of interest
    It would be nice to see ‘No conflicting interests.’ Unfortunately, this is rare in ADHD drug studies, and this one is no different. What we see is this: “HL has received grants from Shire Pharmaceuticals, personal fees from, and has served as a speaker for, Medici, Shire/Takeda Pharmaceuticals, and Evolan Pharma AB, and sponsorship for a conference on ADHD from Shire/Takeda Pharmaceuticals and Evolan Pharma AB, all outside the submitted work; SC has received reimbursement for travel and accommodation expenses from the Association for Child and Adolescent Mental Health (ACAMH) in relation to lectures delivered for ACAMH, the Canadian ADHD Alliance Resource, the British Association of Psychopharmacology, and the Healthcare Convention and CCM Group team for educational activity on ADHD; SC has also received honorariums from Medice and serves as chair of the European ADHD Guidelines Group, all outside the submitted work; ZC has received speaker fees from Takeda Pharmaceuticals, outside the submitted work; no other relationships or activities that could appear to have influenced the submitted work.”

    I don’t mean to suggest it’s a badly performed or intentionally misleading study. The authors have clearly made considerable effort to eliminate bias and are very open about the limitations. However, the press and wider public never pay any attention to this. The headline result just becomes unimpeachable gospel because it’s peer-reviewed science. But when you add publication bias (would a study showing no effect even get published?) to the limitations, it’s weak evidence of anything.

  • Does obesity really cost the UK £126 billion per year?

    A study has found that obesity costs the NHS £126 billion per year.

    Having gone through a PhD in the economic costs of disease I don’t even need to read the study to know the given figure is meaningless. Studies claiming that ‘disease x costs the economy y amount’, otherwise known as cost of illness (COI) studies, are widely perceived as a joke, even by the economists who make them.

    You only need to look at systematic reviews to see why COI studies are so poorly regarded. The costs for any given disease can vary wildly from negative costs to millions of pounds per person. One review found that the total healthcare costs for a number of common diseases in the US were double the country’s entire health spending.

    Even in theory, few economists agree on how the costs of illness can be measured. A particular point of contention is how to measure lost productivity, i.e. the output a sick (or dead) person would have produced had they been well. Many researchers just multiply the average wage by the number of people unable to work, which tends to produce a high illness cost, while some assume that any ill workers will be replaced and only a friction cost should be counted. The ‘correct’ cost (whatever that even means) is likely somewhere in between and dependent on the particular illness and conditions of the economy. But these are hard to measure and tend to give a lower cost, which doesn’t make such a good headline.

    But what about the healthcare costs? Surely we can measure these? In practice it’s complicated. Healthcare systems tend not to have accounts divided up by disease and attributing healthcare costs to a particular disease is tricky. Even calculating the overall cost of a particular patient’s treatment in the NHS relies on a lot of guesswork and averaging, as there are many fixed costs and variable costs to be considered. In addition, many diseases can be risk factors for other diseases. Should we include the costs of these diseases? It’s not an easy question. We might simply take the excess costs of people with the main disease, but if we also did this for the other diseases and added all the net costs, the combined total could be higher than the actual overall costs. We can adjust for comorbidities but the causal chains are so complex that separating out disease costs is always problematic. Economic deprivation underlies much obesity and many other diseases, so is the cost of obesity not ultimately the cost of economic deprivation? I would go even further and say that the economic costs of obesity are part of the costs of modern capitalist society (in other types of society obesity is extremely rare). Attributing these costs to particular diseases is impossible on theoretical and practical levels.

    Ultimately, the costs of an illness are not measured but imputed on the basis of many questionable assumptions. In theory they are the savings that would be made if the disease did not exist. But we can’t measure this counterfactual and in most cases it’s too abstract to relate to anything concrete.

    Another problem with COI studies is that better treatment and improved survival tend to raise illness costs, which seems counter-intuitive. For instance, cancer is becoming more expensive because new treatments are costly and survivors are living longer, hence using more healthcare. This actually isn’t an error; the costs to healthcare systems really do go up as we are seeing.

    Hence COI studies give the rather strange conclusion that the richer a country is, and to some extent the better its healthcare system is, the more costly disease becomes. So diseases prevalent in developed countries, like cancer and diabetes, will appear more costly than, say, malaria in the Global South. In essence, COI studies tend to be a combination of how much we can pay to treat a disease with the average wages in a country, and the main determinants are how rich the country is and how disruptive the disease is (or perceived to be). And if we choose to put more resources into a disease based on these costs, the costs will rise even further, compounding the problem.

    What about the suffering an illness causes? Why do we not see studies with disease x causes y suffering? While we may use lives lost, we don’t have an objective measure of suffering. We could use QALYs or DALYs but few people understand those. Most people understand money though, and a big sum of money sounds impressive. But couldn’t we assign monetary value to the suffering? We could do this, and some economists do, but it entails many dubious assumptions and can lead to double counting as economic analyses tend to consider costs per QALY.

    In many ways these studies underestimate the true costs of a disease, particularly in diseases affecting poorer countries, for reasons described above.

    But even in Britain, what about the cost to all our lives of being overweight? And what about the risk factors for other diseases? The £126 billion (less than £2000 per person) if anything underestimates the actual cost.

    Most of the problems with COI studies have been known since the 1960s. So why do researchers keep producing them?

    • they make headlines
    • we (or at least politicians) care more about the economy than well-being
    • we don’t question the validity of things we agree with
    • only things that are measured matter (to politicians).

    COI studies are basically lobbying disguised as scientific research. The obesity study may be driven to encourage and justify adoption of weight loss drugs. Alternatively, it might be to prod politicians towards taxing junk foods. I don’t think this is a bad goal, but it won’t solve much.

    If we eliminated obesity, would we all be a couple of thousand pounds richer? It’s unlikely. The costs would migrate somewhere else. Modern healthcare systems are engaged in a game of whack-a-mole. Fix one issue another pops up. The tacitly assumed but never publicly acknowledged underlying fact is that improved health ultimately leads to worse health and higher costs. This is because improved healthcare leads to increased longevity and it’s widely accepted that ageing populations are the main cause of increased healthcare spending. If we cured cancer it likely wouldn’t save any money because of all the additional spending on dementia care and other diseases in old age, in addition to the increased spending on pensions. That’s not to say curing cancer wouldn’t be worthwhile, just that economic grounds shouldn’t be the main ones for treating diseases.

    It’s a symptom of modern Britain that the cost to the economy is considered more important than the cost to actual people.

  • Does drinking champagne really reduce the risk of cardiac arrest?

    The headline: Drinking champagne could reduce risk of sudden cardiac arrest, study suggests.

    But does the study actually suggest that?

    The full text article. For some reason scientific articles don’t get linked to in newspaper stories.

    The study used data from the UK biobank and the authors attempted to reduce confounding and show causality through Mendelian randomisation.

    However, the authors acknowledge that confounding is due to much more than genetics. Despite the Mendelian randomisation, it doesn’t seem that confounding was handled well in this study.

    Now it may well be that alcohol intake improves cardiovascular health. More likely they are both associated with socialising and higher socioeconomic status, which have positive effects on health in many ways, and may themselves be the result of better health.

    The study found a stronger protective association for wine and champagne than for beer and cider. This suggests an underlying association with socioeconomic status and socialising: people who drink wine and champagne will tend to be richer and socialise more than beer and cider drinkers. Further evidence of this is that loneliness and isolation were negatively associated, as were depression, tenseness and other negative feelings.

    The study also found that using a computer reduced risk of cardiac arrest. However, playing computer games raised the risk. So what does that say about using computers? Not much I suspect.

    Using sunscreen had lower risk, which was likely due to higher sun exposure and taking more holidays.

    Hand-grip strength had the second strongest protective association (just behind forced expiratory volume). Does this mean that exercising your hands will the reduce risk of cardiac arrest? Maybe a little bit but probably less than going for a walk. More likely hand-grip strength reflects underlying fitness.

    Unfortunately cross-sectional studies using public data are always prone to confounding, and seldom identify primary causes.

    They lead to data dredging for associations that are trivial, spurious or incidental. They throw up all these unhelpful headlines that cause confusion and distrust, while doing little to reduce health burdens. They take away resources from higher quality longitudinal studies.

    In any case, the difficulty in reducing health problems is with effecting lifestyle and societal changes, not identifying risk factors. We have a pretty good idea of which things are good and bad for health.

    The problem is that most people don’t follow the guidelines. And ultimately if people want to engage in unhealthy behaviours that’s their choice.

  • How much do we really work?

    When asked how many hours they work, people tend to give the hours spent in paid employment. But paid work isn’t the only work people do. If ‘work’ only meant paid work then hunter gatherers and slaves must have spent their lives in idle leisure. That is obviously absurd.

    So what exactly do we mean by ‘work’?

    Physicists define work as the energy transferred when moving an object. More generally, work is effort directed towards a particular goal. Hence we have housework, homework, woodwork etc. In modern usage, work usually refers to time dedicated to activities for financial payment.

    The definition matters, because conflating work with paid employment underestimates the total amount of work that is done. Attempts have been made to incorporate unpaid work into GDP measures, but without great adoption. Still, we should be mindful that we work a lot more than is captured in hours of paid employment, particularly as these are used as evidence of improving living standards. If it turns out we work more than hunter gatherers worked prior to civilisation and technology, it wouldn’t say much for modern economies.

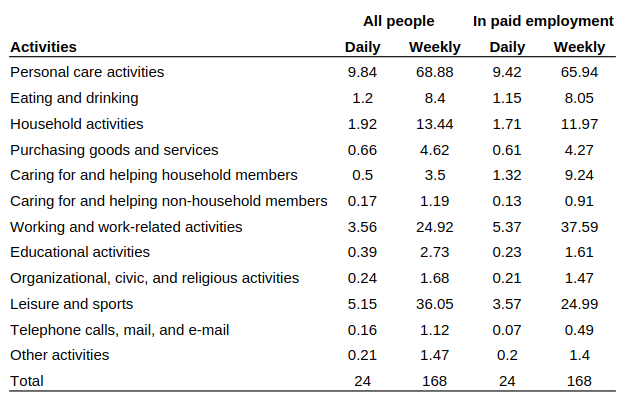
    The Bureau of Labor Statistics American Time Use Survey 2023 asked Americans how many hours a day they spent on various activities.

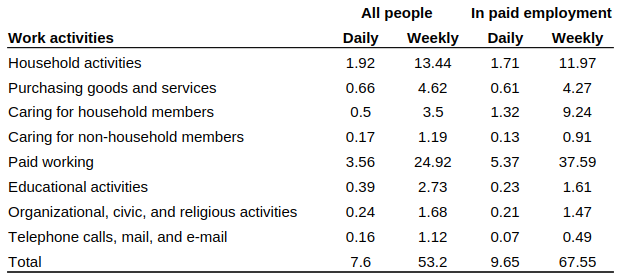
    The average hours spent in paid employment and related activities, were 3.56 for all people and 5.37 for employed people. These are average figures spread over seven days, which work out at around 25 hours per week for all people and 37.5 hours for employed people.

    This leaves quite a few hours left over. So what else are people doing with their time and how much of it should really be considered work?

    The breakdown looks like this:

    Table showing hours spent on daily activities for people in the US.
    Hours spent on daily activities for people in the US aged 15 and above

    Personal care activities include sleeping, toilet breaks, grooming, and sex apparently. You could certainly make a case that grooming and even sex count as working. But this seems contentious and no further time breakdown is given so for simplicity’s sake I will omit all personal care activities. Similarly for eating and drinking; although these are things necessary for survival they do not count as work.

    Household activities, according to the text, are housework, hence clearly work.

    Whether purchasing goods and services count as work is debatable. Some people shop for pleasure. I find it tedious and stressful and would much rather be doing other things. This should count as work as it takes effort, is essential for survival, and we have little choice but to undertake it.

    Caring for other people seems to me obviously work. Educational activities can be pleasurable but should also count as work. Organizational, civic and religious activities aren’t well defined but to me fall into the work category.

    Leisure is obviously not work. Sports I consider non-work. Exercise should probably count as work but the amount of it that Americans do is so small it makes little difference to the total.

    Telephone calls, mail and email seem to me obviously work.

    The study does not record how much time is spent on social media and other internet browsing. It seems likely these are included in leisure activities or socialising and communicating.

    This gives a revised figure of 7.6 hours of work per day for all people, 9.65 for employed people. These amount to 53.2 hours and roughly 67.5 hours per week respectively.

    Hours spent on work activities for people in the US aged 15 and over

    How accurate are the data? They record 43.9% of respondents as being in work, much lower than the figures given in other statistics (FRED, Statista) of around 60%. The reasons given for the discrepancy are that the inclusion age started at 15 rather than 16 and that the survey was conducted on all days rather than just weekdays. Another likely reason is that the survey sampled households by telephone when many would be at work. This, combined with the exclusion of grooming and exercise, very likely means the average working hours are an underestimate.

    Estimates for the number of hours worked per week among hunter gatherers are in the range of 15 to 45. Even the higher end of these estimates is substantially lower than the working hours of an average modern-day American.

    Modern work is physically less demanding but has less autonomy and more stress. Moreover, the lack of physical effort is causing severe health problems. We should be spending much more time on exercise to compensate, which would increase our work time further. Americans only spend 0.21 hours per day on exercise while hunter gatherers would have been physically active for much of the day.

    Only 29.2% of respondents engaged in socialising and communicating each day while only 21.1% participated in sports and exercise (this includes spectator sports). This compares to compared to 73.7% who watched television each day. The average time per day spent on socialising was 34 minutes compared to 2.67 hours watching television.

    It’s little wonder many people suffer mental health problems and burnout. We are simply working more, while socialising and exercising less, than our minds and bodies evolved for.

    There is also an underlying philosophical issue. Activity only counts as work when some other person or organisation is willing to exchange money for it. It’s essentially a form of servitude. Meanwhile, the work we do for ourselves is considered valueless. This makes autonomous living seem a selfish indulgence; a primitive, animalistic way of life.

    Concurrently, work is deprived of pleasure; it is a burden to be endured, a ritual of suffering to placate society. Not only is work unpleasant. It should be unpleasant, and if it isn’t, it’s not considered real work. Hence the scorn for creative professions.

    And of course, most modern work is unpleasant. In contrast, many traditional working activities such as hunting, fishing, weaving and foraging, are today undertaken purely for pleasure; some people in fact pay considerable sums to perform them. But people don’t work in accounts for fun, or telemarketing. No one (at least no one sane) does B2B sales for a hobby. A few may tinker with electronics and computer programs, but generally on ‘fun’ projects the market has no interest in. If AI automates away our current paid activities, it will be interesting to see how many continue to be practiced for pleasure alone.

    Modern life with all its conveniences mighy be comfortable, but not necessarily fulfilling. Previous generations may have worked harder, but for fewer hours, and with a stronger distinction between work and relaxation. We exist in a perpetual netherworld of sort-of-work, fixed to our screens, simultaneously bored, stressed and dissatisfied. Things will likely change as AI takes over. Whether or not for the better remains to be seen.

  • How can we reduce the ingestion of microplastics?

    Once thought inert, plastic has been found to disrupt endocrine function while contributing to allergies, inflammation and even cancer. Global treaties on its production and disposal are sorely needed. But what can we do as individuals to limit our personal exposure to plastic and prevent its accumulation in our bodies?

    How does plastic get into our bodies?

    Due to the complexity of the problem and the lack of studies, the pathways by which microplastics (MPs) reach our bodies are not well understood. A single MP of size 1 µm to 5 nm can break down into billions of nanoplastics of less than 0.1 μm. Airborne MPs are believed to be the main source. These are of two types: indoor and outdoor.

    Outdoor MPs mostly derive from vehicle tyres. Other sources include paint and litter and just about anything made of plastic that sits outside and gets worn down and blown away by wind.

    Indoor airborne MPs mainly arise from degradation of household plastic products,e.g. synthetic furniture, carpets, electronic equipment, paint, kitchen utensils, clothing and footwear.

    After airborne MPs, the next biggest source is ingestion through food and drink. Drinking water and other liquids from plastic bottles are high in MPs, tap water less so. Seafood and salt are high in MPs due to the concentration of ocean plastics. That doesn’t mean other food is clean; the accumulation of MPs in rivers, sewage sludge and the atmosphere makes pretty much all food contaminated. Plastic packaging contributes further. Even products in metal and glass containers are not immune; tin cans have plastic linings and the tops of glass containers contain plastic. Teabags can also contain plastic while disposable coffee cups usually have plastic linings. Food containers, cooking utensils and cleaning products can also contribute. Non-stick linings in pots and pans can contain plastics that leach during cooking.

    Other sources are beauty products and toiletries. These generally come in plastic packaging and some products contain microbeads, though these have been banned in many countries. Toothbrushes have plastic bristles which degrade over time, releasing MPs into the gums and throat.

    Absorption through the skin is believed to be much lower than through the digestive and respiratory systems, but can still contribute. Using smartphones, computers, remote controls and other plastic devices introduces MPs to our skin, which may cause inflammation. Synthetic clothing is an additional source of MPs on the skin, and contributes to airborne and water-borne MPs. Childrens’ toys are most often made of plastic, and likely to get rough treatment.

    What can we do to reduce intake?

    Given the omnipresence of MPs, particularly airborne ones, is it even possible to substantially minimise exposure? Other than moving to rural areas and avoiding busy roads our capacity to avoid outdoor MPs is limited. The move to electric vehicles may make the problem worse because EVs tend to be heavier than ICE equivalents.

    However, some evidence suggests that indoor MPs contribute more than outdoor ones. Reducing these may entail substantial changes to our homes, such as replacing or covering synthetic carpets, furniture, electrical equipment and clothing, but is at least within the power of individuals. Bear in mind that disposing of plastic textiles and other household items could create additional plastic pollution.

    Other ways of reducing MP intake are:

    • use tap water rather than bottled water
    • buy fresh, local produce rather than packaged supermarket items
    • use alternatives to sea salt
    • use raw food products rather than processed food
    • avoid plastic in cooking and food storage: e.g. non-stick pans, plastic food processors, plastic containers
    • use natural cleaning products
    • wear clothing with natural fibres where possible
    • wash synthetic clothing separately with a microfibre filter
    • avoid paints that contain plastic and synthetic varnishes.

    The extent to which such measures can reduce plastic in the body is unknown, but could be substantial. And many of these measures will promote health and ethical consumption, so are worth doing for their own sake. Ultimately, though, microplastics are impossible to avoid and, like most things pollution-related, individual actions have limited effects.

  • The staggering increase of artificial substances

    A recent study indicates an alarming increase in cancer rates among young people. While the causes are unclear, environmental factors, particularly pollution and artificial substances, are strongly suspected to contribute to this emerging trend.

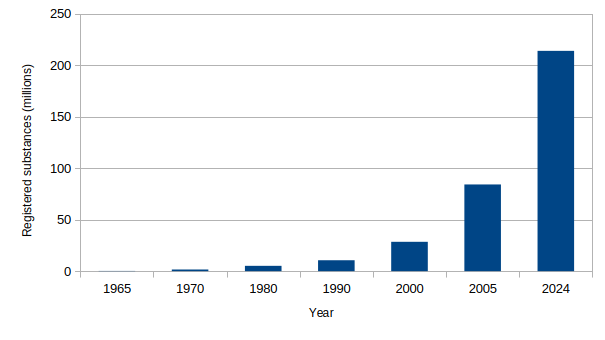
    While most of us are aware of the rapid rise in greenhouse gas emissions, equally astounding has been the growth of artificial substances. Over 200 million new chemical substances have been registered in the CAS (Chemical Abstracts Service) Registry to date and millions are added each year.

    Chart of registered chemicals over time  since 1965, showing exponential growth
    Number of chemicals registered in the CAS Registry by year

    The number of chemicals in use has been estimated at around 350,000 with over 2000 new chemicals released every year in the US alone. Few have been tested for safety. The number of possible interactions is astronomical. Many of these chemicals are used in everyday products like pharmaceuticals, food, toiletries, clothes, furniture and beauty products. Many are forever chemicals that build up in the environment. A large number are single-use plastics that end up in the ocean. The effects on unborn children are unknown. The full effects on the environment are unknown. The effects on our immune systems are largely unknown but have likely contributed to the rise in autoimmune diseases, mental health problems, allergies, cancers and other non-communicable diseases.

    The proportions of artificial substances that are harmful have been estimated by the Environmental Protection Agency (EPA). The corresponding number of harmful substances (based on 350,000 chemicals in use) is shown below:

    HazardNumber and % of chemicals (350,000 total)
    Acute toxicity46,900 (13.4%)
    Toxic to reproduction8,750 (2.5%)
    Mutagenicity13,650 (3.9%)
    Carcinogenicity6,300 (1.8%)
    Danger to aquatic environment12,250 (3.5%)
    EPA study on AQUIRE (AQUatic Toxicity Information Retrieval) and RTECS (Registry of Toxic Effects of Chemical Substances) for over 100,000 listed substances

    Only a few dozen of these chemicals have been banned.

    To describe this as an experiment would be inaccurate, because an experiment would suggest we can make changes based on the results. In just a few hundred years we have irrevocably altered our environment in ways we do not and cannot fully understand.

  • Does sport actually improve health?

    As students of elementary statistics learn, correlation does not equal causation. Yet much of the research used to drive policy conflates the two.

    For example, sporting participation and good health are positively associated. From this it has been extrapolated that promoting sport will lead to better population health.

    It is trivially obvious that people who engage in sports tend to be healthier, because physical activity mostly leads to better health. But physical activity and sport are not identical.

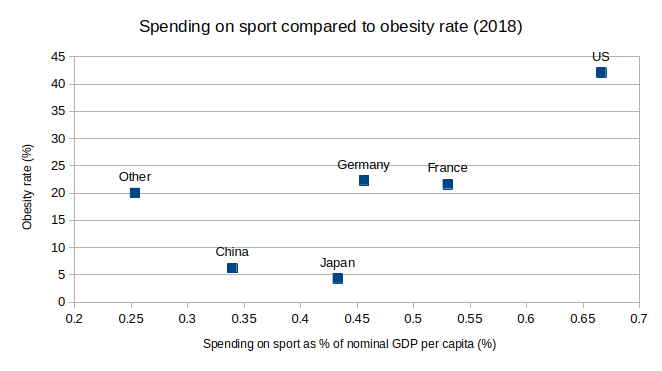
    Consider this chart, showing the relationship between spending on sports and obesity rates at a population level (unfortunately Statista charges an exorbitant amount for detailed country stats hence only a few countries are shown). As a country’s general prosperity may affect rates of obesity and sports spending, the chart is adjusted for GDP per person.

    Chart of spending on sport compared to obesity rate adjusted for GDP per capita of large countries.

    Sources:
    https://www.statista.com/statistics/1087429/global-sports-market-share-by-country
    https://en.wikipedia.org/wiki/List_of_countries_by_GDP_(nominal)
    https://en.wikipedia.org/wiki/List_of_countries_by_obesity_rate
    https://database.earth/population/by-country/2018

    While these data are admittedly crude, they do not suggest that higher spending on sport improves population fitness.

    There is, in fact, scant evidence at all that professional sport encourages healthy behaviour, and some evidence suggests it does the exact opposite through sponsorship of unhealthy products. While sports stars are held up as role models, and prominent sporting events may encourage people to take up sports, participation does not last. Children are made to play sports at school during physical education lessons. But this does not seem to encourage lasting participation either, and if anything has the opposite effect. Many children enjoy informal physical games outside school, but lose interest when they become a requirement and their performance is formally ranked.

    Why is lasting participation in sport, as opposed to merely watching sport, so low in adults?

    With sport there is generally a competitive element, and almost always so with spectator sport. Competition creates winners and losers, with corresponding positive and negative emotions. People who excel at sport tend to be naturally fitter and they tend to continue participating because of the pleasure of performing well. Those who perform poorly at sport tend to be less fit naturally and are less keen to continue due to the displeasure of performing poorly. Even if their team wins, those who aren’t fit tend not to enjoy the experience, may feel shame at their poor performance, and will tend to drop out. Hence any correlation between sport and good health can be explained by reverse causality and survivorship bias. It may be that those who did badly at sport would improve their health if they kept at it, but people don’t like losing. Hence sport promotes health in those already fit and discourages it in those who need exercise most. When competitive sport is virtually synonymous with physical activity, this can lead many into inactive lives, as we are seeing.